Understanding your organization’s structure is like having a map—it’s essential for smooth operations and success. A hierarchy chart does just that, visually laying out who’s who and how everyone fits together.
A hierarchy chart visually maps out this structure, showing how different roles within the company connect and interact. Whether you’re looking to create one for your business or just want to grasp the concept, this guide covers the basics, uses, and best practices for designing effective hierarchy charts.

What is a Hierarchy Chart?
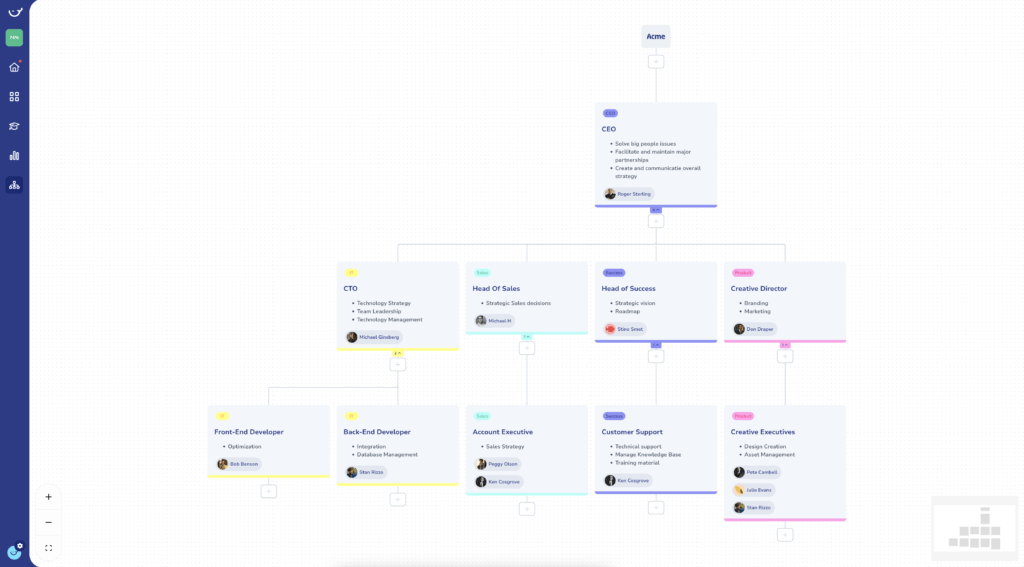
A hierarchy chart, sometimes called an organizational chart, is a visual representation of your company’s structure. It’s all about showing the different roles and how they connect, usually in a top-down layout.The top positions are usually the highest-ranking, with lower-ranking roles branching out beneath them. This setup makes it crystal clear who reports to whom, which is crucial for communication and planning.
The main goal of a hierarchy chart is to clarify who reports to whom, making it easier for employees and stakeholders to understand the chain of command. This clear visualization is essential for smooth communication and effective organizational planning.
Easy Steps to Create a Hierarchy Chart
Building a hierarchy chart might seem daunting, but it’s easier than you think. With these steps, you can craft a clear and functional representation of your organization’s structure.
1. Define the Purpose
What’s the purpose behind your hierarchy chart? Are you outlining roles for a department or mapping the entire organization? Knowing why you’re creating it will help you decide what to include.
2. Identify Key Roles and Departments
Begin by listing all the roles, starting from the top—think CEO, CFO, and so on. Then move down to department heads, managers, and staff. Group these roles by their respective departments or teams.
3. Establish Reporting Relationships
Next, define who reports to whom. For example, department managers may report to the COO, while team leaders report to department managers. This step is crucial as it forms the backbone of your chart’s structure.
4. Choose a Chart Format
Select a format that best represents your organizational structure. The top-down format is common, but a left-to-right or matrix format might suit your needs better. Choose the one that aligns with how your organization operates.
5. Use a Chart Tool
6. Populate the Chart
Start filling in the chart with the roles and reporting lines you’ve identified. Clearly label each position and ensure the connections accurately represent the chain of command.
7. Review and Update Regularly
Once your chart is done, review it for accuracy and share it with key stakeholders for feedback. Remember, as your organization grows or changes, your chart should be updated to reflect those shifts.
Best Practices for Designing a Hierarchical Structure
Creating a hierarchy chart isn’t just about listing roles—it’s about making sure the chart is clear, effective, and user-friendly. Here are some best practices to consider:
1. Keep it Simple
A cluttered chart is hard to read and understand. Focus on the most critical roles and relationships to keep your hierarchy chart clean and straightforward. For larger organizations, consider creating separate charts for different departments or teams.
2. Use Clear Labels and Titles
Make sure each role is clearly labeled with the job title and, if needed, the name of the person in that position. Clear labels help users quickly grasp the structure and understand responsibilities.
3. Maintain Consistent Design
Consistency is key. Use the same shapes, colors, and line styles throughout the chart—one shape for executives, another for mid-level managers, etc. This consistency makes the chart easier to navigate.
4. Highlight Key Roles
Make important roles stand out by using a different color or a bold outline for positions like department heads or team leaders. This helps draw attention to crucial parts of the structure.
5. Plan for Scalability
As your organization grows, so should your hierarchy chart. Design it with scalability in mind, allowing you to add new roles and departments without needing a complete overhaul.
6. Ensure Accessibility
Make sure the chart is easily accessible to all employees. Place it in a shared digital space where everyone can quickly reference it. This visibility fosters transparency and helps employees see how they fit into the bigger picture.
Uses and Applications of a Hierarchy Chart
Hierarchy charts aren’t just nice to have—they’re incredibly useful tools for various functions within an organization. Here are some common uses and how they can help:
1. Clarifying Roles and Responsibilities
One of the primary purposes of a hierarchy chart is to clarify roles and responsibilities within an organization. By visualizing the reporting structure, employees can easily understand their responsibilities and to whom they report.
2. Onboarding New Employees
New employees often struggle to grasp the organizational structure when joining a company. A hierarchy chart serves as an effective onboarding tool, helping them quickly understand the company’s hierarchy and where they fit in.
3. Strategic Planning and Restructuring
During strategic planning sessions, hierarchy charts can be instrumental in evaluating the current organizational structure and planning future changes. They help identify inefficiencies, gaps, or redundancies in the reporting structure that may need addressing.
4. Communication and Workflow
Hierarchy charts improve communication by clearly defining the chain of command. This clarity helps streamline decision-making processes and ensures that communication flows efficiently throughout the organization.
5. Performance Management
In performance management, charts can assist in setting goals and expectations by clearly outlining each role’s responsibilities. Managers can use the chart to ensure that performance objectives align with the overall organizational structure.
Differences Between a Hierarchy Chart and a Flow Chart
While both hierarchy charts and flowcharts are used to represent information visually, they serve different purposes and have distinct structures.
1. Purpose
- Hierarchy Chart: Primarily used to represent the structure of an organization, focusing on the relationships between different roles.
- Flow Chart: Used to represent a process or workflow, showing the steps involved in completing a task or project.
2. Structure
- Hierarchy Chart: Arranged in a tree-like structure, usually top-down, illustrating the chain of command within an organization.
- Flow Chart: Composed of different shapes connected by arrows, representing the sequence of steps in a process. The shapes often have specific meanings, such as rectangles for processes, diamonds for decisions, and ovals for start/end points.
3. Focus
- Hierarchy Chart: Focuses on people and positions within an organization.
- Flow Chart: Focuses on tasks, processes, and decision points.
4. Use
- Hierarchy Chart: Used for organizational planning, role clarification, and communication of structure.
- Flow Chart: Used for process improvement, workflow analysis, and project management.
Understanding these differences is crucial when deciding which tool to use for your specific needs.
Hierarchy Chart Examples
Understanding hierarchy charts becomes easier when you can see real-world examples. Here are a few common types of hierarchy charts that illustrate different organizational structures:
1. Corporate Hierarchy Chart
In large corporations, the hierarchy chart often features a classic top-down structure.
At the top, you will typically find the CEO, followed by C-level executives like the CFO, COO, and CTO. Below them are department heads (e.g., Marketing, Sales, HR), followed by team leaders and individual contributors.
Example:
- CEO
- CFO
- Finance Manager
- Financial Analyst
- COO
- Operations Manager
- Logistics Supervisor
- CTO
- IT Manager
- Software Engineer
2. Department-Specific Hierarchy Chart
In smaller or more focused segments of a company, a department-specific hierarchy chart can be highly effective.
For example, a marketing department may have a hierarchy chart that details the reporting structure within just that department.
Example:
- Marketing Director
- Content Manager
- Copywriter
- Graphic Designer
- SEO Manager
- SEO Specialist
- Social Media Manager
- Social Media Coordinator
3. Matrix Organisation Hierarchy Chart
In smaller or more focused segments of a company, a department-specific hierarchy chart can be highly effective.
For example, a marketing department may have a hierarchy chart that details the reporting structure within just that department.
Example:
- Marketing Director
- Content Manager
- Copywriter
- Graphic Designer
- SEO Manager
- SEO Specialist
- Social Media Manager
- Social Media Coordinator
4. Flat Hierarchy Chart
In startups or small businesses, a flat hierarchy is often preferred to promote flexibility and innovation. In these charts, there are fewer layers between the top leadership and the employees, creating a more egalitarian structure.
Example:
- CEO
- Developer
- Marketing Specialist
- Customer Support Representative
A flat hierarchy chart demonstrates a collaborative environment where employees have more direct access to leadership, fostering open communication and quicker decision-making.
5. Nonprofit Organisation Hierarchy Chart
Nonprofit organizations often have a unique hierarchy structure due to their mission-driven focus. Their charts might include a Board of Directors at the top, followed by the Executive Director, department heads, and volunteers.
Example:
- Board of Directors
- Executive Director
- Programme Director
- Programme Coordinator
- Fundraising Director
- Donor Relations Manager
- Volunteer Coordinator
- Volunteers
Bottom line?
A well-designed hierarchy chart is more than just a visual aid; it’s a powerful tool that clarifies roles, improves communication, and supports strategic planning within your organization. Whether you’re managing a large corporation, a small department, or a non-profit, creating a hierarchy chart tailored to your specific needs can enhance efficiency and ensure everyone understands their place in the organization.
By following best practices and regularly updating your chart, you can maintain a clear structure that grows with your company. Use the insights and examples provided to build a hierarchy chart that truly reflects your organization’s unique dynamics and goals.
FAQs on a hierarchy chart?
What does a hierarchy chart tell you?
Hierarchy charts also known as org charts are the graphical representation of an organization’s structure.
Its purpose is to illustrate the reporting and working relationships within a business.
What is the tool to create a hierarchy chart?
Whale’s powerful org chart lets you build charts quickly without having to draw or design anything manually.
What is the best way to structure a hierarchy chart?
The chart should be organized in a hierarchical structure, with the highest level at the top and the lowest level at the bottom.